

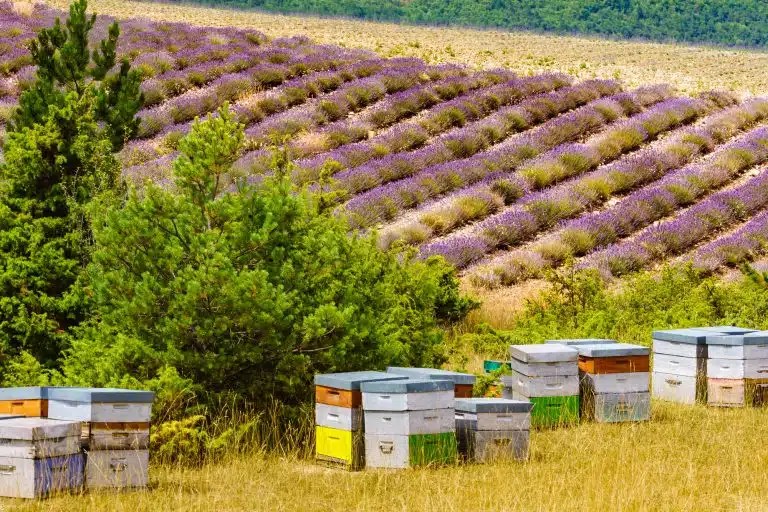
Changing weather and flowering patterns are already affecting the way apiaries are managed. Remote monitoring offers another way to see what happens between visits.
Equipment for a trial installation
 Basic Monitoring Kit: Wooden Scale + 2 Brood Sensors
 Monitoring Kit K2 PRO: BroodMinder Aluminium Scale + 2 BroodMinder Brood Sensors + Cell Hub
The basic kit downloads over Bluetooth at the apiary. The K2 PRO includes a mobile hub. Check local coverage and the separate paid plan before choosing remote transmission.
Test the signal at the hive stand
- Decide whether local downloads meet your needs or whether readings must arrive remotely.
- Include connectivity, subscriptions and time spent reviewing data in the budget.
Scales and temperature and humidity probes have been available for years. They can send measurements straight to a phone or computer, saving a journey just to take a reading. The harder task is interpretation. An algorithm combines measurements over time to highlight a pattern such as a nectar flow or a possible loss of brood activity. The beekeeper decides what the pattern warrants in the hive.
This guide looks at what a system can measure and how those observations can inform supering, harvest, migration, feeding and inspections.
The examples come from the BroodMinder team and a workshop given by Lorenzo Pons on 28 November 2025 at the forestry school in Santa Coloma de Farners, Spain. The figures describe the equipment and demonstrations shown at that workshop.

What the sensors measure and which decisions they support
The equipment presented at the workshop included the following.
Hourly weight and estimated daily gain
- The scale records hive weight by the hour. The app calculates changes between days and plots a daily productivity estimate (chart 1).

A sustained net gain suggests that nectar is coming in. A change in the curve helps you time a visit to check super space, harvest readiness or a possible move.
Temperature and estimated brood activity
- A probe above the frames measures temperature. An algorithm estimates brood activity from how steadily the colony maintains a temperature near 35 °C. In the example, a steady reading near that value corresponds to the top of the model’s brood scale. A lower, more variable temperature produces a lower estimate. A displayed 100% is a model output, not a claim that every frame contains brood. Compare trends with flowering, weather and observations of the colony. A change might accompany queen replacement, swarming, mite pressure or hornet activity (chart 2).
Probe position and actual colony strength affect the estimate. Check it against the brood you see in the hive.
Reading weight and brood estimates together
- Plotting weight and estimated brood activity together helps compare colonies over a season (chart 3). A strong, consistent record can help shortlist colonies for breeding, alongside direct observations of health, temperament and performance.

Using temperature records to assess feeding and insulation
- Compare the trend before and after a management change. Does estimated brood activity increase after feeding? Does a divider, insulating cover or white-painted roof change the temperature pattern? Comparable hives and similar exposure make the comparison more meaningful (chart 4).

Weather and the nectar index
- The system can download a weather forecast for the apiary and plot it against the hive records. An algorithm combines outdoor temperature, relative humidity, rainfall and wind into a “nectar index”. This estimates how suitable the weather is for nectar production, while the scale records what actually comes into the hive (chart 5).

When one flowering plant dominates the site, record how its flow tracks the nectar index over several seasons (chart 6).

If daily weight gain tracks the index across several reference hives, the colonies appear to be using the flow. The same comparison can help time supering, a move or the separation of floral harvests. Check ripeness and floral origin separately before taking supers (chart 7).

Flight radar and pollination activity
- A radar unit at the front of the hive detects movement. An algorithm then estimates forager activity (chart 8). Wasps and even wind-blown leaves can contribute to the signal. Keep vegetation clear of the entrance and inspect unusual readings before treating them as bee traffic.

The system provides a remote record of flight activity when colonies are hired for pollination. It complements flower visits and crop observations (charts 9 and 10).


A sustained fall in flight activity and weight during otherwise favourable weather can justify an urgent inspection. Pesticide exposure is one possible cause among several. The sensors alone cannot establish what happened.
From monitoring data to practical alerts
High nectar index, flat weight. Look at forager activity and the brood trend. A short inspection can tell you whether the colony is weak, has a queen or health problem or simply lacks access to a usable flow at that site.
Weight rises despite an unpromising index. Look for irrigation, a nearby crop or a favourable microclimate that the forecast misses. Base supering on the measured gain and check which plants the bees are visiting.
Several days of declining productivity. Compare weather and activity. A wet spell may explain the drop. If flight also falls in good weather, inspect one or two reference hives for a colony problem, robbing, hornet pressure or an exposure incident before changing the entire apiary plan.
Both activity and weight fall in good conditions. A change within hours calls for a prompt check for disturbance, an exposure incident, temperature stress or a sensor problem. A gradual decline may reflect falling colony strength. A field inspection distinguishes the possibilities.
The temperature curve becomes jagged and estimated brood falls. Check weight and flight alongside it. During the visit, examine brood pattern, eggs, stores and health. Queen trouble, recent swarming or pressure from mites or hornets can produce similar curves.
Estimated brood rises but weight does not. A growing colony may be consuming as much as it brings in. Check stores before dividing it or taking honey. Record feeding so that you can interpret both the brood and weight curves.
Weight rises strongly for several days. Check available comb space and add a super before the colony is crowded. If you want to separate floral harvests, start checking ripeness as the flowering period changes.
Weight levels off and the nectar index falls. Check the forecast and flowering calendar. The likely explanations include a weather break and the end of a flow. Decide whether to wait, move or focus on colony maintenance.
Radar reports unusually high activity at an odd hour. Check for vegetation or wasps at the entrance. Clear the sensing area and compare the signal with a visual count before assuming bees are foraging.
Sudden, out-of-pattern weight changes. Compare with handling times and strong winds. Check the stand, level and load-cell seating. If the equipment is sound and nobody worked the hive, inspect the installation for disturbance.
Weight, brood estimates, flight and weather are most informative together. When two or three curves move at once, they give you a more focused question to take to the apiary.
Costs and when monitoring pays for itself
Remote records can avoid unnecessary journeys and make the remaining visits better timed for feeding, supering and health checks. FranceAgriMer’s 2012 cost data, reproduced in chart 11, illustrate how important travel was in the operations studied. Calculate your own costs using current travel time, fuel and labour.

The example in chart 12 shows how the return changes with distance from the apiary. Include the purchase price, subscription, batteries and time spent reviewing data. Check the terms of any current local support scheme before counting a grant in the calculation.

A system also needs someone to review the curves and record what inspections actually find (box 1).

Monitoring is most likely to repay its costs at scattered apiaries, migratory sites and paid pollination placements. Ten hives five minutes from home present a very different calculation, although their data can still be interesting.
Getting started: a suggested kit and where to install it
At the workshop, the proposed starting setup covered one or two apiaries of up to roughly 50–100 hives. The example hardware had an estimated autonomy of about five months under its operating conditions.
- Two W4 two-load-cell scales were used as examples, with a stated working precision of around 100–200 g. The scale supports one side of the hive. Level the opposite support and follow the installation instructions for that design.

- Two flight radars on the same hives as the scales.

- Four internal temperature sensors: one in each of the two weighed hives and one in each of two other hives.

- A hub with weather data receives the readings from the scales, probes and radars and relays them to the phone or computer.

Choose representative colonies, for example a strong one, a middling one and a weaker one. Monitoring only the best colony gives an over-optimistic picture of the yard.


Connectivity and installation in the field
The sensors send readings to a hub, which forwards them at intervals over a suitable mobile network. Where the sensor-to-hub link is the limiting factor, a compatible long-range radio arrangement may help. A relay still needs a working path to transmit the data to the service.

Test coverage where the hub will actually stand. Shade on a solar panel, vegetation in front of a radar and a scale on an uneven base can each undermine a different part of the system.
Other projects presented at the workshop
The team also described the following projects.
- Phenocast, a database of flowering observations.


- BeeTV, a camera that can be fitted to a hive frame.

The workshop also illustrated experimental image-based detection and counting of Varroa mites.

Placed in front of a drone comb, a camera can also be used to observe when eggs start appearing in drone cells.

In another demonstration a camera faced an onion flower in a greenhouse. The system classified and counted honey bee visits separately from other visitors, such as hoverflies, to plot bee visitation over time.

A useful record ends in a testable decision: which hive to visit, when to go and what to look for once you arrive.


