

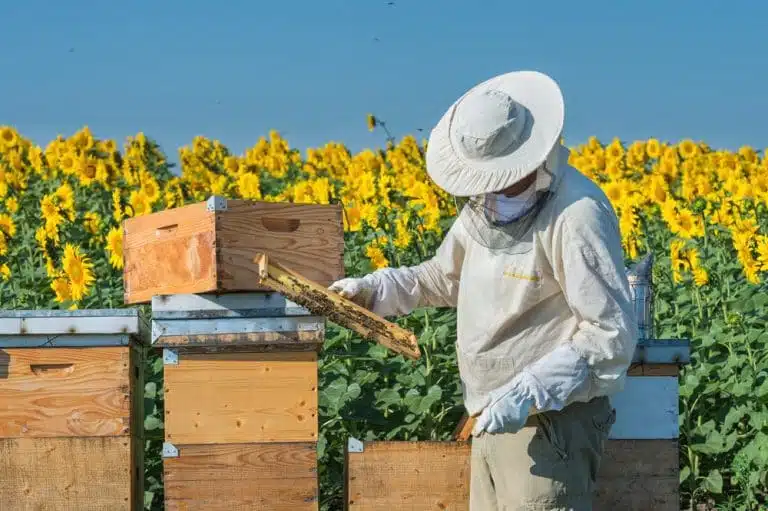
A hive scale and well-placed temperature and humidity sensors can help you decide which apiary needs a visit first. They can draw attention to low stores, possible swarming or a short nectar flow. The diagnosis still comes from an inspection, but you can arrive with a clear idea of what to check.
Hive sensors and what each one tells you
| Sensor | Position | What it can tell you | Our assessment |
|---|---|---|---|
| Weight | Under the hive | Nectar flow, net gain, consumption of stores and sudden population changes that warrant a visit | The most useful overall. Rain and drying can shift a reading by as much as 0.5 kg. |
| Temperature | Inside the hive | Brood activity and changes in colony heat regulation. A sudden shift needs investigation. | A valuable partner to a humidity sensor |
| Humidity | Inside the hive | Persistent damp and changes in the hive environment. Compare the colony with its own usual readings. | Useful, although propolis and wax can distort the readings |
| Entrance counter | Hive entrance | Flight activity, daily peaks, returns and changes in bad weather | Useful for following activity |
| Sound | Inside the hive | Possible clues to queen status, preparation for swarming or stress. Interpretation depends on the colony and microphone. | Our test microphone became dirty and gave a constant 400 Hz reading that was of little practical use. |
| Gases, including CO₂ | Inside the hive | Changes in ventilation and metabolic activity | In our experience, costly and sensitive relative to the management decisions the data support |
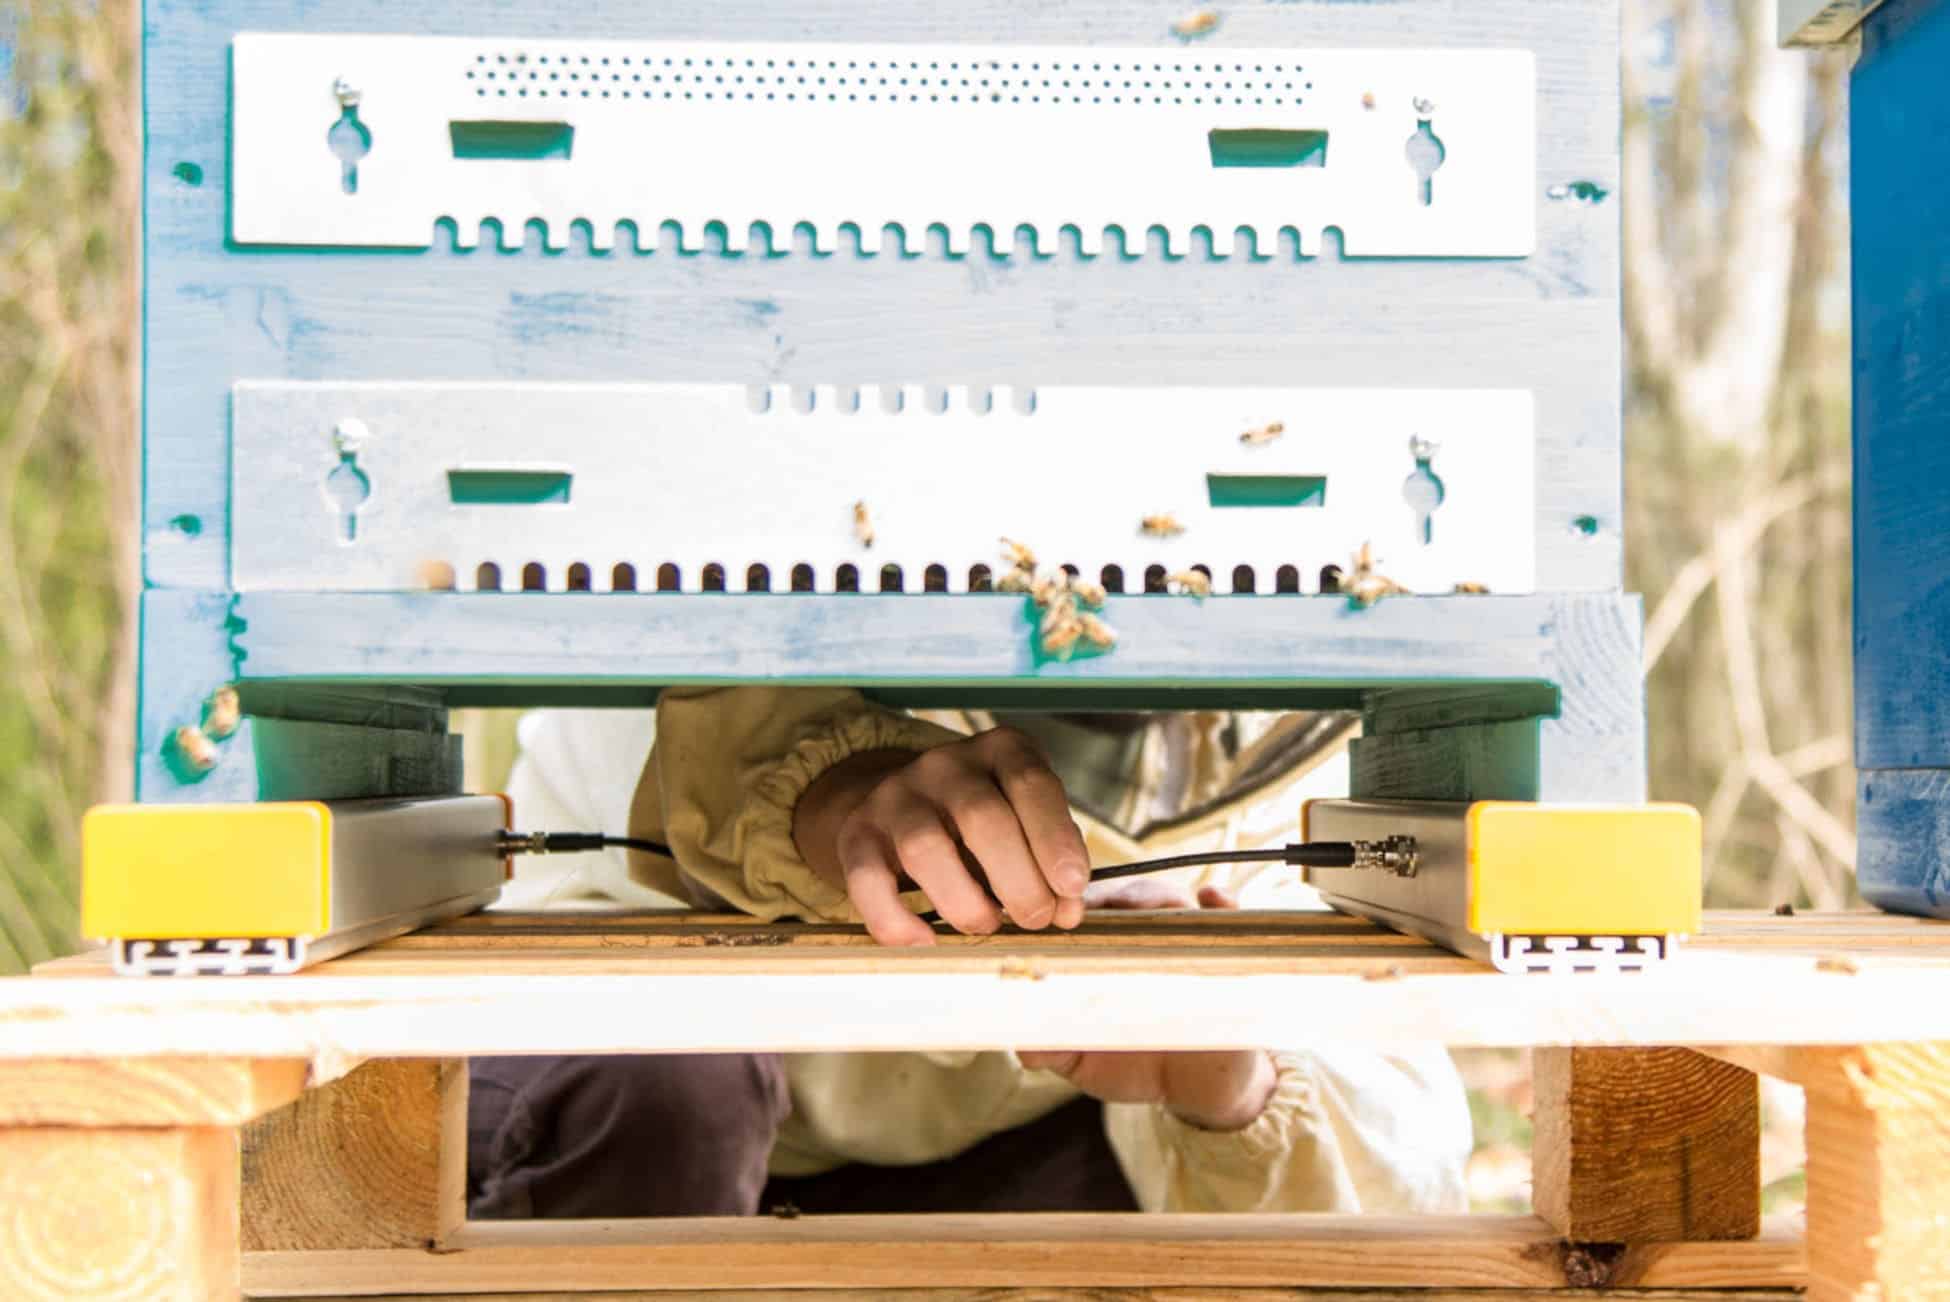
A scale and a temperature and humidity sensor


The W4 measures weight and the TH measures temperature and humidity. They can be read over Bluetooth. Remote access from home requires the appropriate gateway, coverage and services.
Read the curves alongside your apiary notes
- Record rain, inspections and any equipment you add or remove.
- Check the colony before acting on an unexpected trend.
In this guide
- Which measurements tell you about which changes
- When remote monitoring pays off
- How to choose equipment
- How to interpret the readings through the season
Unpredictable flowering and weather can mean inspecting apiaries more often. A remotely monitored reference hive gives the beekeeper more frequent observations without a journey for every reading.
Which measurements are worth following?
Temperature, humidity and weight each reveal a different part of colony life.
Watching their trends can help with the following decisions.
- Following brood development as one consideration in Varroa management, alongside mite counts
- Choosing when to check honey supers for harvest
- Checking whether a shortage of incoming nectar is drawing down food reserves
- Prioritising a colony for a swarming inspection
- Investigating an unusual change in flight activity after a possible pesticide exposure
- Checking for excessive or persistent damp inside the hive
Here is what each type of sensor adds.
Weight
A scale under the hive can show changes associated with the following.
- The start and end of a nectar flow
- Net gain during the flow
- A sudden loss of weight consistent with swarming
- Changes over the season
- Use of food stores and when to inspect them
- Daily departures and returns of foragers
- A loss of activity that needs an on-site check

Sound
A microphone inside the hive has been investigated for possible clues about the following.
- Queen status
- A loss of activity that needs an on-site check
- Preparation for swarming
- Changes in colony activity in winter
Studies have explored links between particular frequency bands, queen status and preparations for swarming. A frequency recorded on one microphone and hive cannot be applied to every other setup.
The sensor we tested became dirty and produced a virtually continuous reading near 400 Hz. We could not use it to make reliable decisions.
Temperature
A temperature sensor inside the hive can help with the following observations.
- A sudden drop calls for a check. Possibilities include a swarm, loss of bees, a cluster moving away from the probe or a sensor or battery problem.
- Brood is normally kept at about 33–36 °C, with the centre often around 34–35 °C. A probe near the brood should show a steadier temperature than the air outside.
- If internal temperature starts tracking the weather, the colony may no longer be regulating the area around the probe. Confirm its position and the condition of the bees before concluding that the colony has died.
- A departure from the colony’s usual pattern is a reason to visit and examine it.

Gases
A gas sensor inside the hive can reveal changes associated with the following.
- Ventilation and colony activity
- Metabolic activity
- Changes that may warrant a health check
- Reported carbon dioxide readings in this article range from 0.1% to 4.3%.
We found these sensors comparatively expensive and delicate. It was hard to translate the figures into practical decisions.
Bees entering and leaving the hive
An entrance counter gives a different view of the colony.
- Overall flight activity
- The busiest time of day
- A sudden departure consistent with swarming
- The proportion of foragers returning
- The effect of changing weather on flight
When does remote hive monitoring pay off?
A season’s record helps determine where to go first and how urgently. Timely checks on a colony losing weight or behaving abnormally can save a journey, a feeding emergency or a colony.
Use the data to prioritise inspections. An alert suggests what might need attention and the beekeeper checks the cause on site.

The saving comes from making better-timed visits as well as fewer unnecessary ones. Finding starvation or a health problem early can protect the colony and its crop.
Which equipment can I use?
Several systems combine remote probes and scales. Start with the decisions you need to make and the mobile coverage at the apiary.
Alerts can cover temperature, humidity, signal loss or low battery. A useful alert gives you time to investigate and makes clear which sensor triggered it.
Choose housings suitable for their intended use in a hive, with materials appropriate wherever contact with bees, honey or food-contact surfaces is possible.
The hive unit transmits readings to an app or dashboard on a phone, tablet or computer. Comparing several colonies in one apiary can be more informative than looking at a single line in isolation.
Intermittent transmission extends battery life. Choose a reporting interval that balances the change you need to detect with the battery and signal available.
Reading monitoring data through the beekeeping year
| Season | What the sensor shows | What to check |
|---|---|---|
| Start of the season | Gradual warming. Illustrative daily rates in the source range from about 0.1 °C in January–March to 0.4 °C in April–June and 0.5 °C in August–September. | Possible resumption of brood rearing or arrival of a swarm in a previously empty hive |
| Nectar flow | The super becomes warmer or more humid and hive weight rises. | Bees may be filling the super. Arrange a visit to check usable space and ripeness. |
| Active season | A sudden drop in temperature, sometimes accompanied by lower humidity | Check for swarming, loss of bees, cluster movement or a probe or battery fault. Compare outdoor temperature and weight. |
| Active season | A gradual fall | Check brood, space, queen status and food availability. |
| End of the season | Gradual cooling | Often consistent with less brood. Base Varroa decisions on mite counts and the management programme. |
| Winter | A sudden drop | Check promptly for shortage of stores, a health problem, cluster movement or a faulty sensor. |
| Any season | The probe closely follows outdoor temperatures. | The monitored area may no longer be heated. Check where the cluster is and whether the colony is alive. |
At the start of the season
The brood nest is normally held around 33–36 °C.
A gradual rise near the centre can accompany resumed laying or a newly arrived swarm. The Spanish article cites example rates of about 0.1 °C/day in January–March, 0.4 in April–June and 0.5 in August–September. Treat these as observations from particular conditions, not universal thresholds.

During a nectar flow
A probe in a honey super can help you see when bees begin working there.
A temperature rise indicates activity. Higher humidity may accompany incoming nectar. Together they can help time an inspection for harvest, although capped comb and honey moisture still need checking.
A scale adds another piece of evidence: a sustained weight increase as the supers fill.
How to read a nectar flow on a hive scale
The weight curve shows when a flow starts, when it tails off and how strongly the hive is gaining.
- Look for the first sustained increase. The flow is ending when the curve levels out or begins to fall. Recording those dates year after year shows whether the harvest window at your site is changing.
- Weight rises as nectar comes in and often falls overnight as the bees consume stores and evaporate water. Compare readings taken at the same time on consecutive days to work out net gain.
- Compare the net gain with other colonies in the same yard to distinguish a single-colony problem from a poor flow. Compare it with previous years to put the crop in context.
In his 2026 talk on beekeeping decisions in a changing climate, Manuel Barquín described a Cantabrian flow lasting about ten days. At his sites, former peak gains of 2–3 kg had fallen to about 1.5–1.7 kg on the best days. A shorter, weaker flow leaves less surplus even with a strong colony. The Farrar principle helps explain why having a large foraging force ready in time matters.
Allow for rain wetting the hive and subsequent drying. Changes of about 0.5 kg can occur without any change in stores. Record anything you add or remove, including roof weights, feeders and supers.

During the active season
A sudden fall in temperature warrants an inspection. A swarm, fewer bees or a moving cluster may account for it, as may a dislodged probe or failing battery. Compare humidity, weight and outdoor temperature.
A gradual decline may coincide with less brood, lack of space, queen loss or a forage shortage. Weather and hornet pressure can also reduce activity.
An outdoor temperature and humidity probe gives the internal readings a reference point. Site it so that sun or rain does not distort the comparison.
As the season draws to a close
A gradual drop in temperature is often normal as brood rearing and forage availability decline.
This is the start of winter preparation. Use mite counts, professional guidance and the authorised product label to plan Varroa control early enough to protect developing winter bees.

In winter
Check a pronounced fall promptly. Food shortage or a health problem are possibilities, but so are a moving cluster, a loose probe and a failing battery. Compare the outside temperature and the weight record before drawing conclusions.
The cluster may be at the opposite side of the hive from the sensor. A cold probe can therefore miss a warm, healthy cluster.
Throughout the year
In a hot Spanish summer, outside air can exceed 36 °C. Bees use water and ventilation to cool the brood nest. Beeswax softens with heat, and a heavily loaded new comb can sag or collapse. In extreme conditions a fallen comb may obstruct the entrance.
If the internal probe follows the outdoor temperature continuously, visit to check the bees. If the colony has died, prompt action can help prevent robbing.
Humidity varies with probe position, ventilation, incoming nectar and brood. Look for sustained departures from that hive’s normal readings, then check on site.
Wax or propolis on the sensor can distort humidity readings. Examine it before acting on an unexpected value.
A University of Córdoba study in southern Spain reported brood-nest humidity typically around 50–60%. In the conditions studied, readings did not exceed 60% in the brood chamber or 70% elsewhere. Climate, probe position and colony condition all affect how such figures should be used.
A relative humidity of 90% is sometimes cited when discussing mould. It would be a poor universal alarm threshold for the Spanish apiaries described here.
If damp persists, inspect the entrance, roof, leaks, colony strength and unoccupied space. Address the cause and match the hive volume to the bees.
Persistent damp, cold draughts, a weak population and inadequate or poor-quality stores can all contribute to winter losses.
References and image credits
Miguel Ángel Rodríguez Ramos, Véto-pharma Spain.
Images: Arnia, United Kingdom.
Ana Diéguez Antón, European Agricultural Fund for Rural Development, SOST-APÍCOLA project.
S. Gil-Lebrero and colleagues (2020). “Regulation of Microclimatic Conditions inside Native Beehives and Its Relationship with Climate in Southern Spain”, Sustainability, 12(16), 6431. University of Córdoba.
M. Barquín (2026), talk on beekeeping decisions in a changing climate, Asociación Montañesa de Apicultores.
Frequently asked questions
What do beekeepers measure when they monitor a hive?
Weight, temperature and humidity are the common starting points. Other devices record sound, gases or bee traffic at the entrance.
Can monitoring replace inspections?
It helps you choose where to go first and what to look for. Inspect the colony to establish the cause and decide what to do.
What temperature is normal in a hive?
The brood area is usually around 33–36 °C. Outside that area the temperature can be very different. If a probe starts closely tracking the weather, check where it sits relative to the cluster and inspect the colony.
What humidity is normal inside a hive?
There is no single normal range for the whole hive. Position, ventilation, nectar and brood all matter. In one southern Spanish study the brood area was typically at 50–60% relative humidity. Compare a reading with that colony’s own history.
Can I trust a hive scale?
Yes, if you record what happens around it. Rain, drying or moving a stone off the roof can all shift a reading. Compare the same time each day and record changes to equipment.
Are sound and gas sensors worth buying?
In our trials they gave less actionable information than weight and temperature. Our microphone became dirty and reported a constant 400 Hz, while the gas sensors were expensive and difficult to interpret.
What should I look for in a sensor that goes inside the hive?
Choose materials suitable for the intended contact, an installation the bees can tolerate and a transmission interval that fits the available signal and battery life.
Further reading
- How to inspect a hive when the readings show a visit is due.
- The Farrar principle and the productivity of a strong colony.
- How to prevent swarming and interpret the warning signs.
- Understanding and managing Varroa (in Spanish) alongside regular mite counts.


